
Today, we publish the 2021 Commitment to Development Index (CDI), which tracks powerful countries' policy efforts on development across eight important areas, from development finance to migration. One of the CDI's focal areas is the environment, which matters for everyone but is especially critical to people in lower-income countries. In a key year for climate negotiations, the CDI can tell us which countries are doing well on policies to protect the environment and which have room for improvement.
The CDI environment component looks comparatively at 40 countries across key policy areas, from fossil fuel subsidies to emissions levels to carbon pricing. We find that the top-ranking countries—Sweden and France—score well on both development and environment. But wider trends in policy for climate are not encouraging. In this blog we look holistically at the latest emissions data across CDI countries, and we highlight key policy areas—incorporating fossil fuel subsidies and production to carbon pricing—where countries are leading or lagging.
Assessing environmental commitment to development
The CDI produces one of the few comparative assessments of international environmental contributions. Following our review of the CDI last year, we reworked the environment component to have a stronger focus on the different dimensions of climate policy while also capturing other environmental issues, including fishing subsidies and biodiversity and other treaty participation.
As with all indicators in the CDI, each environmental indicator is calculated in a comparable way—often per head, or relative to national income (GNI). The indicator weights are chosen to reflect our judgement on the importance of the indicators; though to keep things simple, each of the eight components carries equal weight in the overall CDI score.
Development leaders also lead on the environment
In the 2021 CDI, Sweden and France rank first and second overall, which are also their ranks in the environment component. Portugal, Spain, and Chile complete the top five on environment. You can see the full environmental rankings here.
Figure 1. Top 10 performers on the environment component
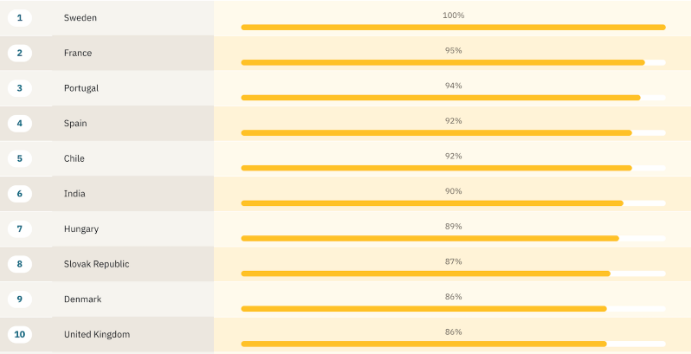
An image of the top 10 performing countries on the enviroment component
The largest global economies, China and the US, rank 22nd and 37th respectively on the environment component. China's direct emissions are almost double those of the US, but this reflects its population size; a better comparative measure is on a per capita basis, where China's are less than half of the US's. China gives a larger share of its GNI in state subsidies for fossil fuel use, but the US produces more fossil fuels per capita.
Total emissions are on the rise
Greenhouse gas emissions are the most important indicator of climate policy performance. The best-ranked country on the environment component, Sweden, has direct annual emissions of 5 tonnes of CO2 equivalent per head, half the CDI average. India has the lowest emissions per capita, at just over 2 tonnes per head, and ranks 6th in the environment component. The lowest ranking countries on environment—Canada, the US, Australia, UAE, and Luxembourg—each emitted 20 tonnes of CO2 per head or more. These countries' income levels are comparable with Sweden's, but they have direct emissions four times as large.
"Emissions" are not only those directly emitted, although in most cases this makes up the largest share of a country's emissions profile and are the basis of most countries UN commitments. A country can also effectively outsource emissions by importing goods and services from other countries. In this year's CDI we count net emissions, or imported minus exported emissions, whereas last year, emissions from trade were calculated as just imported emissions. The new method thus avoids double counting in-country emissions for products that are exported. The largest positive net emissions per head from trade are in Luxembourg and Switzerland. South Africa and Russia are large net exporters of greenhouse gas emissions and China is a slight net exporter. Emissions from land use and land-use change are recognised as more difficult to measure, though we prefer to include some estimates rather than exclude them.
Summing all three types of emissions (direct, trade, and land use and land-use change), total emissions across all CDI countries were higher in this year's CDI (using the latest available data as at end May 2021) than the 2020 CDI. However, 29 of the 40 countries in the CDI did reduce their per head emissions.
Figure 2. Net emissions per head, direct and indirect (trade and land use), tonnes per year
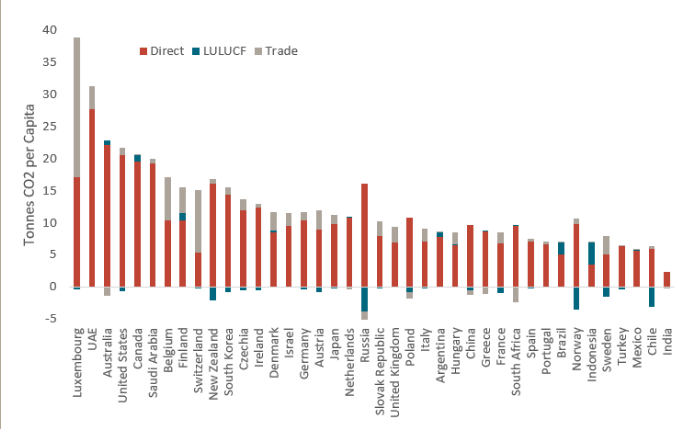
An image of the net emissions per head, direct and indirect (trade and land use), tonnes per year
Source: Authors' analysis of data from Potsdam Institute on emissions, 2018 (Direct Emissions), FAOSTAT, 2019 (Land Use Change and Forestry, LULUCF), and Global Carbon Budget, 2018 (Trade)
Pricing carbon and fossil fuel policy incentives
One key policy tool in addressing climate is the pricing of carbon, particularly through emissions trading.
Carbon prices as assessed in the CDI are the additional cost imposed on emitting 1 tonne of CO2 from emissions trading schemes and carbon pricing schemes. On average, CDI countries' pricing schemes add $10 to a tonne of carbon—largely unchanged over the past year and well-short of most estimates of the social costs of carbon (an authoritative report suggests $50-100 per tonne will be needed to reach net zero). A quarter of CDI countries have yet to implement carbon pricing. Still, there are some movements in a positive direction. Australia set a price of $6.3 per tonne emitted, stepping up from no additional cost in the prior year. South Korea's emissions trading scheme expanded, with the price rising almost 50 percent and reaching $24.6 per tonne in 2020. China's national emissions trading scheme launched this year but is not yet expected to add much to its carbon pricing. Despite raised ambitions, no country reaches Sweden's level, where each tonne is priced an additional $55.8.
Figure 3. Carbon pricing – additional cost per tonne emitted added by policy
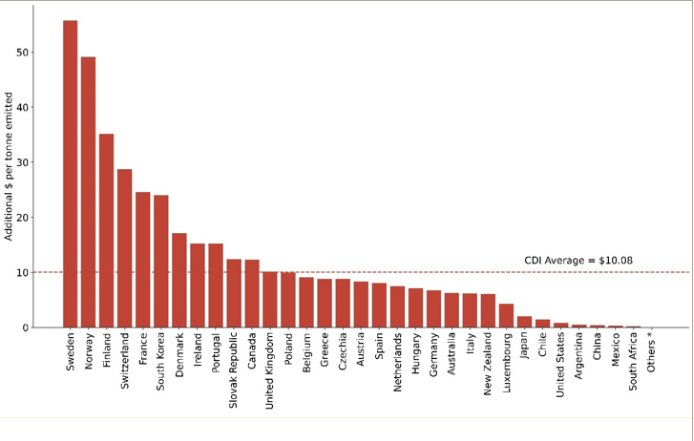
An image of Carbon pricing – additional cost per tonne emitted added by policy
Source: Authors' analysis from Commitment to Development Index, data from World Bank Carbon pricing dashboard; Potsdam Institute on emissions. EU ETS pricing allocated according to allowances.
The trend on fossil fuel subsidies is discouraging.
We scale fossil fuel subsidies by the carbon intensity of the fuels they support relative to the cleanest fuel, gas. On this basis, since the previous CDI, direct subsidies for the production and consumption of fossil fuels rose from an average of 0.72 to 0.78 percent of GNI (based on pre-COVID GNI). Chile was the lowest subsidiser, with almost zero subsidies across coal, oil, gas, and electricity, while several countries' subsidies as a share of their income exceed both the amount they provide in development finance and the subsidies they provide for research and development—most notably South Africa, Mexico, Argentina, and Indonesia.
Some progress, but not enough
There is a strong synergy in this year's CDI between the countries that perform well on development overall and those that are strong on environment. There are also some encouraging signs since the previous year, such as Australia, the world's largest producers of coal, implementing a carbon price for the first time, and most CDI countries reducing their per head emissions. However, total emissions of all countries in this CDI are higher than they were in the previous edition and incentives around fossil fuel use are less oriented to divestment than last year. In the face of the climate emergency, it is clear that the most powerful economies and development actors must do more on the environment.
以“聚媒智 启新程——携手构建中阿命运共同体”为主题的“全球南方”媒体智库高端论坛中阿伙伴大会12日在位于埃及首都开罗的阿拉伯国家联盟(阿盟)总部开幕,来自中国和阿拉伯国家约110家媒体、智库、政府机构、企业及国际和地...
 English
 注册
注册
 首页
首页
 动态信息
动态信息
 交流活动
交流活动
 研究成果
研究成果
 成员信息
成员信息
 联系我们
联系我们